I have found many times throughout my career that simple methods can work extremely well and sufficient for business needs. They can be fast and effective than some sophisticated complex methods.
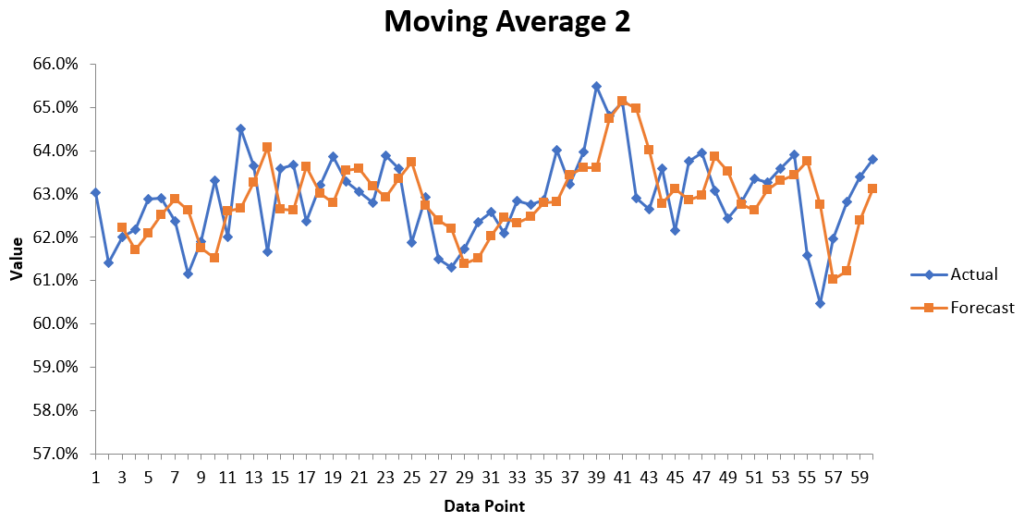
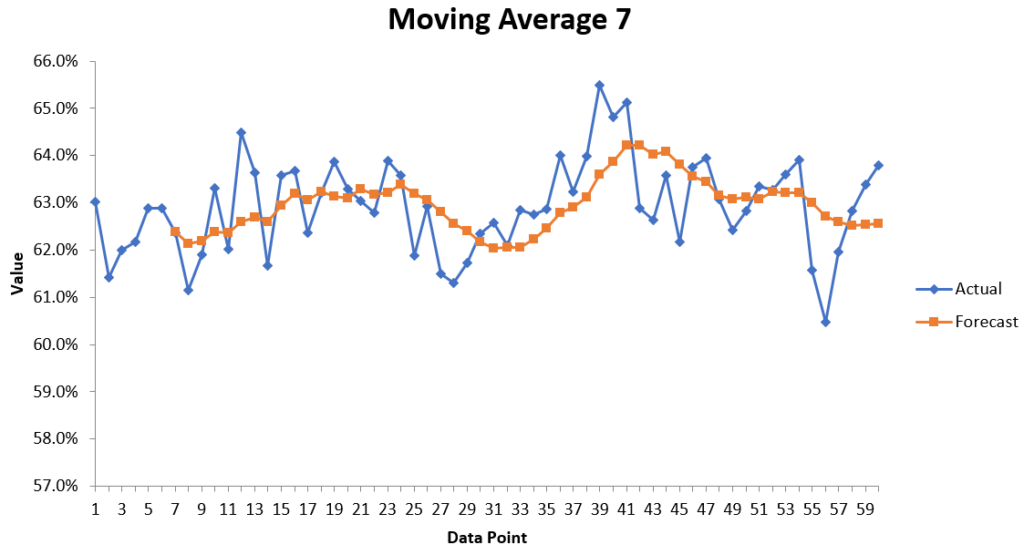
One time I was approached to help forecast the daily number of signups who will convert so that business resources can be planned accordingly. The first thought that came to mind is to predict the conversion probabilities of each signups based on a number of features we have such as demographic and shopping patterns etc. using historical data. However, upon examining the time series of conversion %, I quickly ruled out the need for such a model which can take days if not weeks to build. The series looks like the figure below. The conversion % is moving up and down randomly around 63% without any patterns. The difference between the highest and lowest % is no more than 5%. That is, the data points exhibit random variations around a local mean value that changes gradually over time in a non-systematic way. We can use the simple moving average (SMA) to make the predictions or simply use the previous day value to predict the next day value (the random walk model). The problem with SMA for forecasting is that it is impossible to go beyond the limits of known data. Therefore, for long-term forecasting, other methods are used. However, in this case, we can simply use the average % conversion for long term forecasting (the mean model) and adjust the forecast as we obtain more data.

Moving averages lag behind current date value because they are based on past data; the longer the time period for the moving average, the greater the lag. Moving average helps smooth out the data points by filtering out the “noise” from random short-term fluctuations. We can see from the graphs below that MA7 is much smoother than MA2 and MA3. After applying MA2, MA3 and MA7 on the series, we calculate the MAE and RSME. MA3 has the smallest of both. Therefore, MA3 is picked as the forecasting method in this case.


