One of my previous posts introduced effective data exploration methods. This post will introduce some great R packages for exploratory data analysis. We will still use the same customer churn data for demonstration purposes.
The first package is the DataExplorer package. The package is extremely easy to use. Almost everything could be done in one line of code. To get a data exploration report for the Telco Customer Churn data set with response variable Churn, we can use the following code.
library(DataExplorer)
library(ggplot2)
customer_churn_raw_tbl <- read.csv("yourdirection/Telco_Customer_Churn.csv")
create_report(customer_churn_raw_tbl, y = "Churn")
This code generates an automatic and comprehensive data profiling report. The following image shows the top portion of the report.
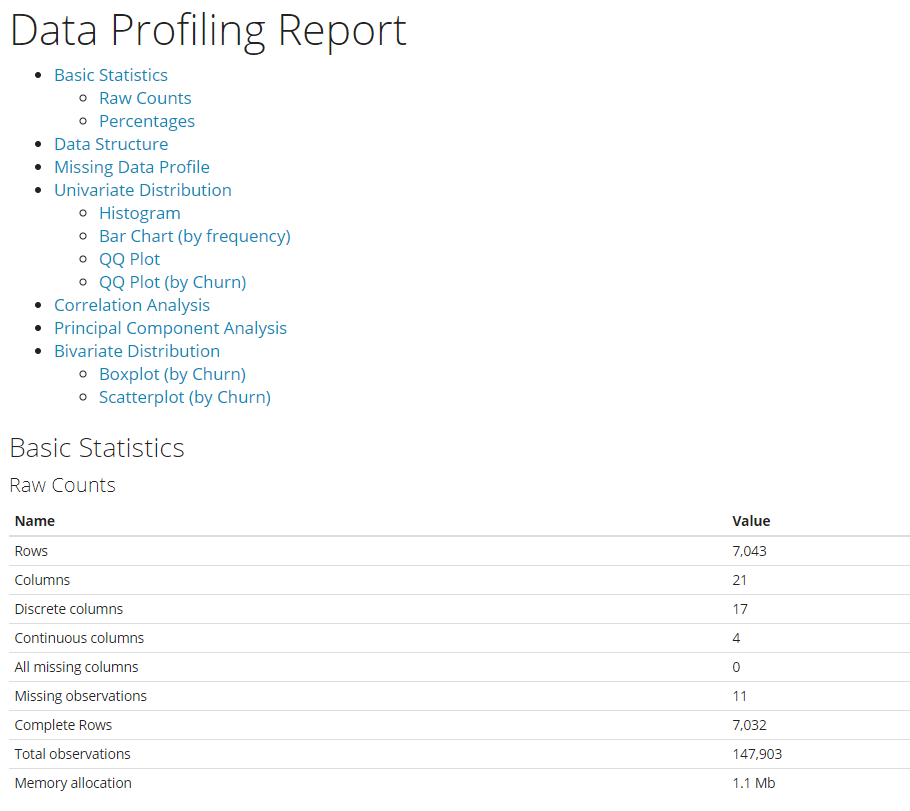
We can also create the elements of the report step by step with the following lines of commands.

plot_intro(customer_churn_raw_tbl)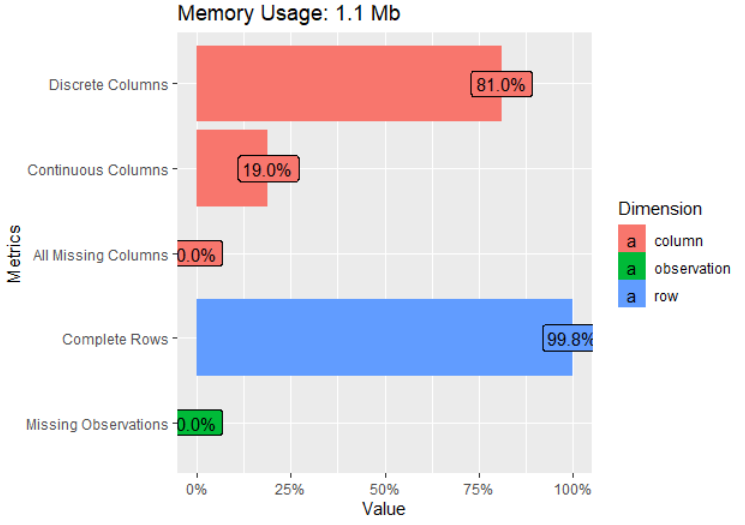
plot_bar(customer_churn_raw_tbl)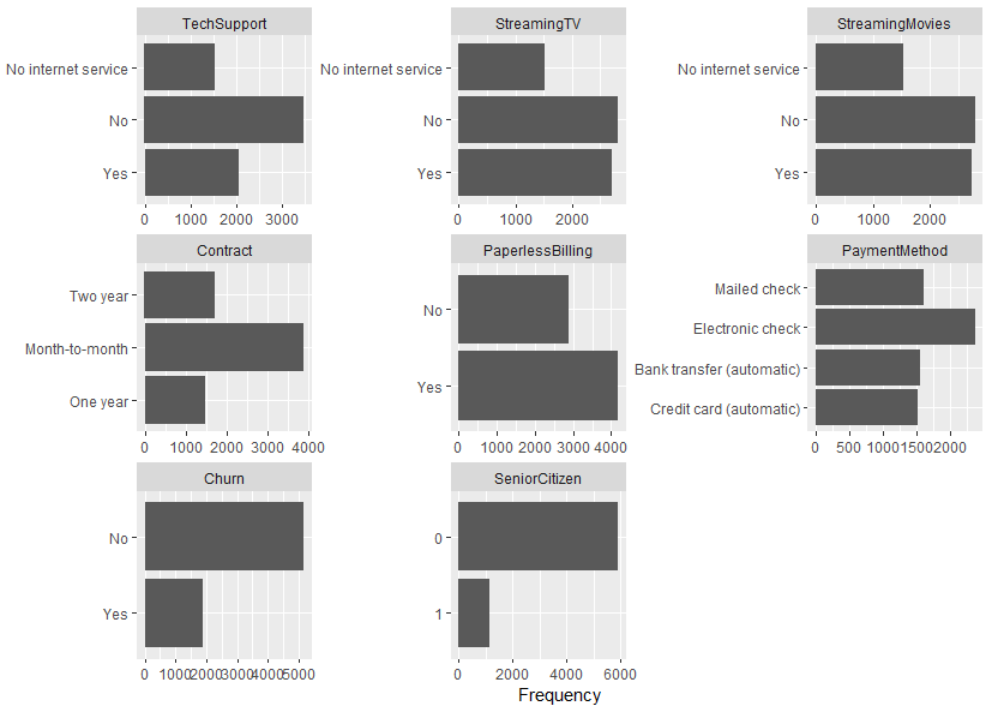
plot_density(customer_churn_raw_tbl)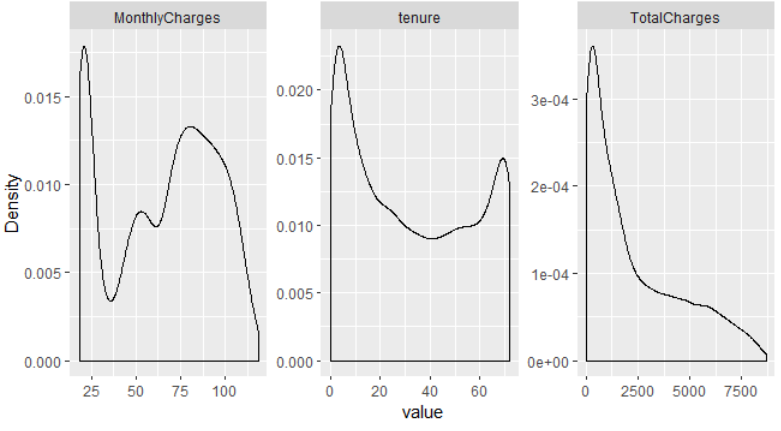
plot_histogram(customer_churn_raw_tbl)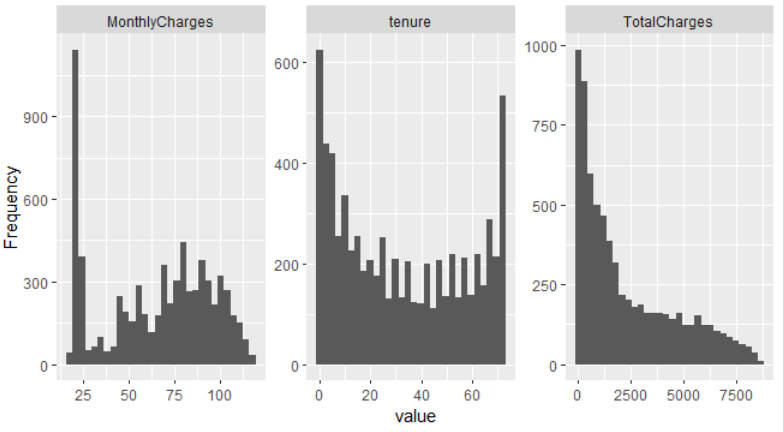
plot_boxplot(customer_churn_raw_tbl, by = "Churn")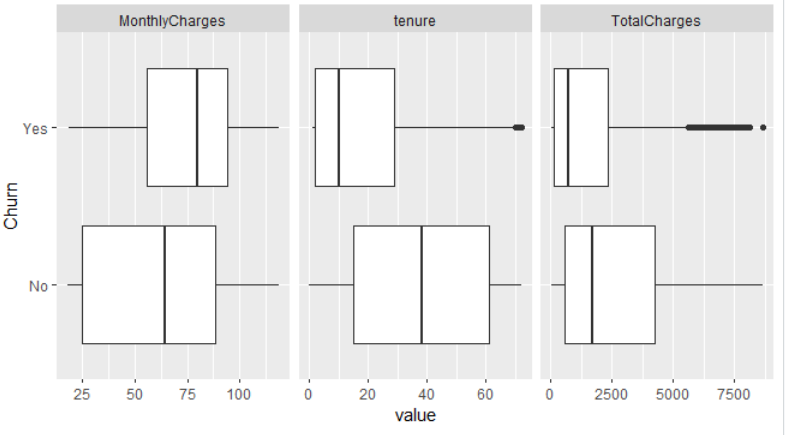
plot_correlation(customer_churn_raw_tbl)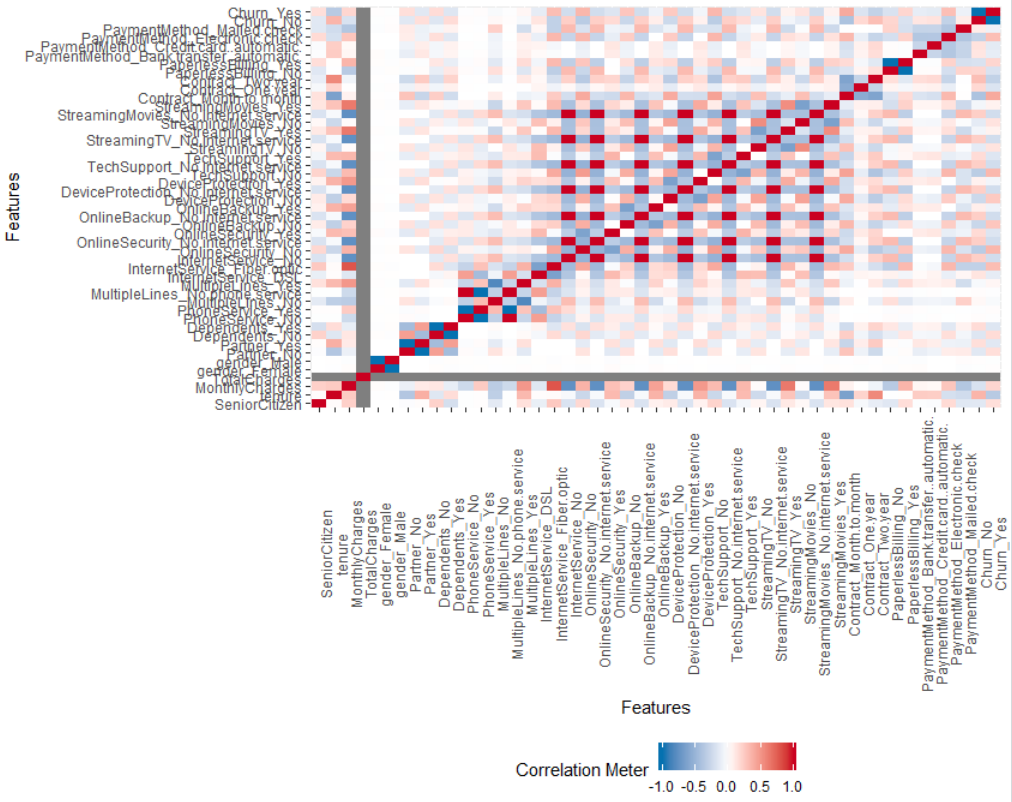
These few lines of code give us a good idea of the variation or distribution of the data set’s categorical and continuous variables as well as the correlation among the variables.
The second R package I want to introduce is the caret package. This package is not designed for data exploration specifically like the DataExplorer package. It has a suite of great tools for machine learning. But I will focus on the cool data exploration function featureplot() that this package provides in this post. This function makes it so convenient to visualize the relationship or covariation of various features with the target variable so we can examine the importance of the features in predicting the target or outcome variable in our future modeling step. Here are the examples for the Telco Customer Churn data set.
# Box plots
library(caret)
featurePlot(x = customer_churn_raw_tbl[,c(6,19,20) ],
            y = customer_churn_raw_tbl$Churn,
            plot = "box",
            strip=strip.custom(par.strip.text=list(cex=.7)),
            scales = list(x = list(relation="free"),
                          y = list(relation="free")))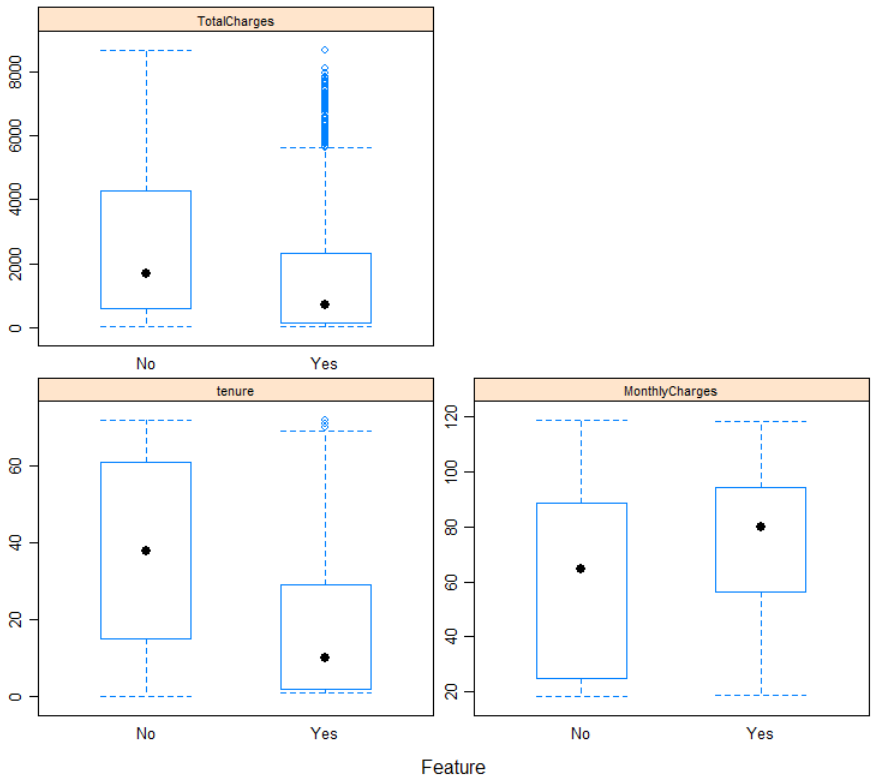
#density plots
featurePlot(x = customer_churn_raw_tbl[, c(6,19,20)],
            y = customer_churn_raw_tbl$Churn,
            plot = "density",
            strip=strip.custom(par.strip.text=list(cex=.7)),
            scales = list(x = list(relation="free"),
                          y = list(relation="free")))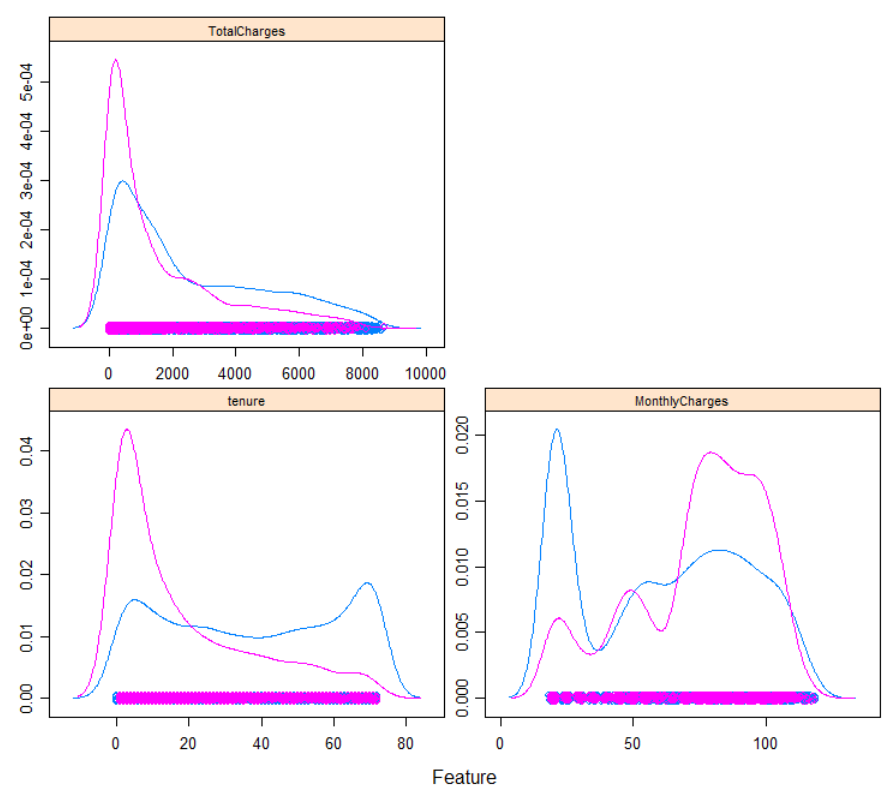
We can tell from these plots that the total charges, monthly charges and the tenure variables’s distributions are different between churned group and the group that did not churn. The three variables are probably important predictors for churn in our modeling step next.
We can also visualize covariation between features using scatter plots.
#scatter plots
featurePlot(x = customer_churn_raw_tbl[, c(6,19,20)],
            y = customer_churn_raw_tbl$Churn,
            plot = "pairs",
            ## Add a key at the top
            auto.key = list(columns = 3))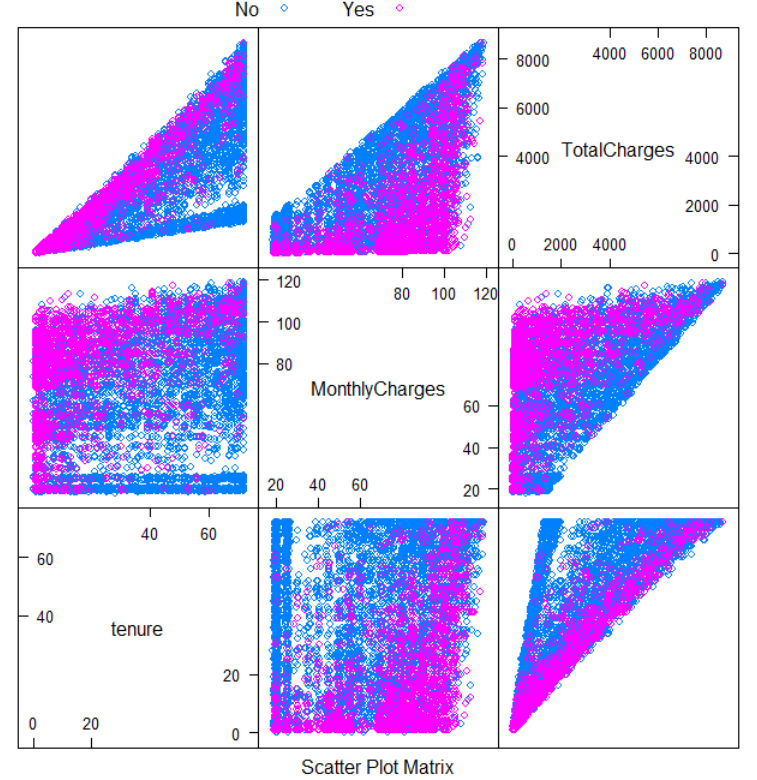
The third package I want to introduce is the funModeling package. It is like caret with an abundant tools for not only data exploration, data engineering, but modeling. And like DataExplorer package, almost all of the tasks can be done with one line of code. Below are some useful commands and sample output from this package.
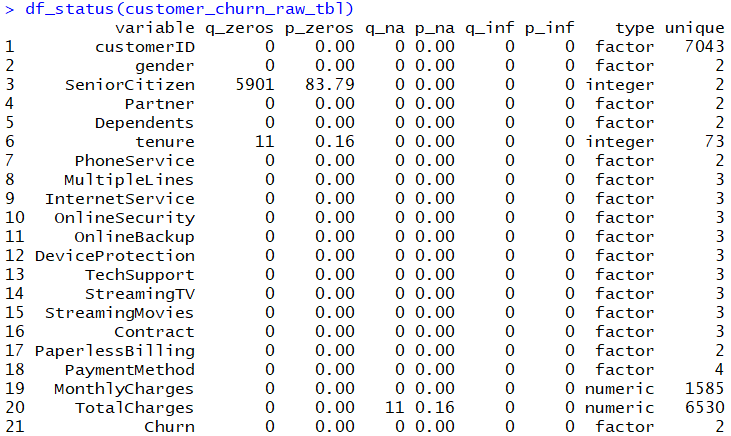
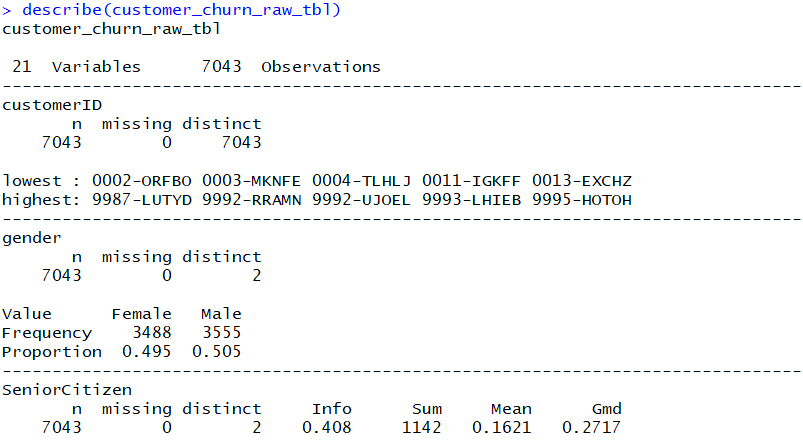
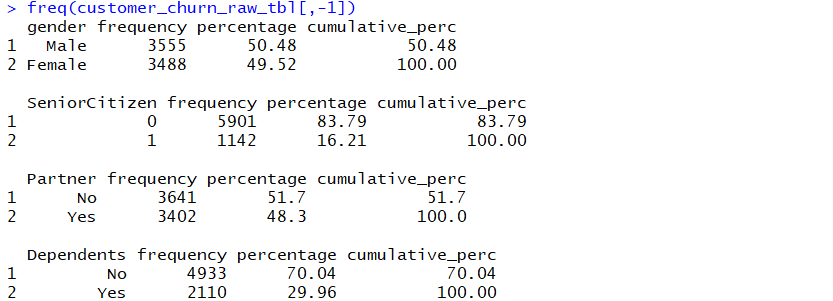
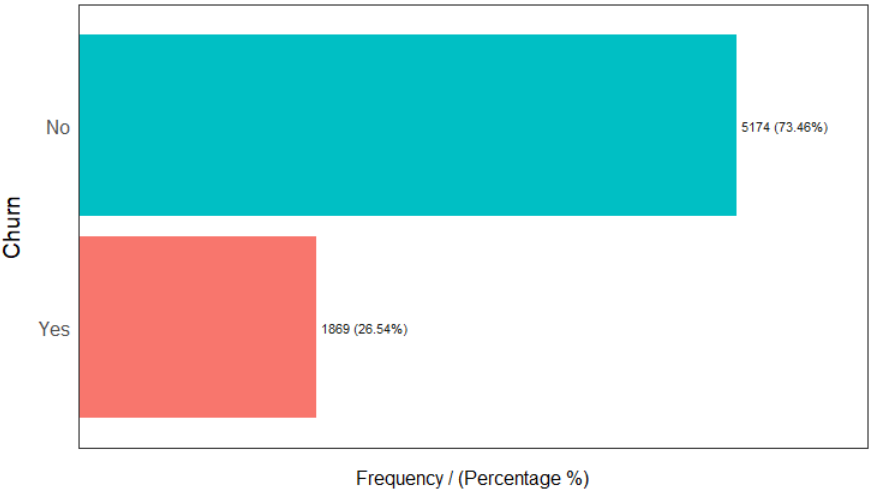
For continuous variables, we can use the profiling_num() and plot_num() for variable summaries and plots. For categorical variables, the freq() function does both the summaries and plots.

plot_num(customer_churn_raw_tbl)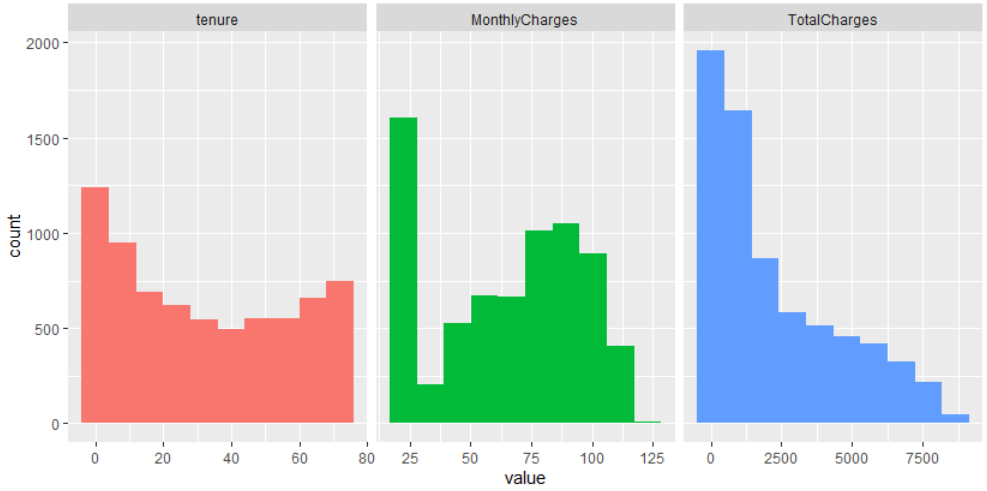
To explore the correlation between target and continuous variables, we can use its correlation_table() function.

End Notes
These are just three packages that I found super easy to use and helpful in data exploration. I am sure that R has many other great packages that can do a nice job in data exploration and there are more nice ones coming up in the near future. Just keep exploring and learning!
Hi! I’m at work browsing your blog from my new iphone 3gs! Just wanted to say I love reading through your blog and look forward to all your posts! Carry on the excellent work!