I love charts. And I believe one of the criteria to separate a great analyst from a OK analyst, a great data scientist from a OK data scientist is whether the analyst or data scientist can convey the information in a chart that’s very intuitive and little brain power is needed for the audience to understand and grasp the information.
As the COVID-19 outbreak started around the world lately, I saw many data and charts on the new and cumulative confirmed cases every day. Majority of the charts I saw used column charts for comparison between countries, which is what column charts are mainly for. Among the popular chart types, bar charts and column charts are good for comparisons, while line charts work better for trends. Scatter plot charts are good for relationships and distributions, but pie charts should be used only for simple compositions — never for comparisons or distributions.
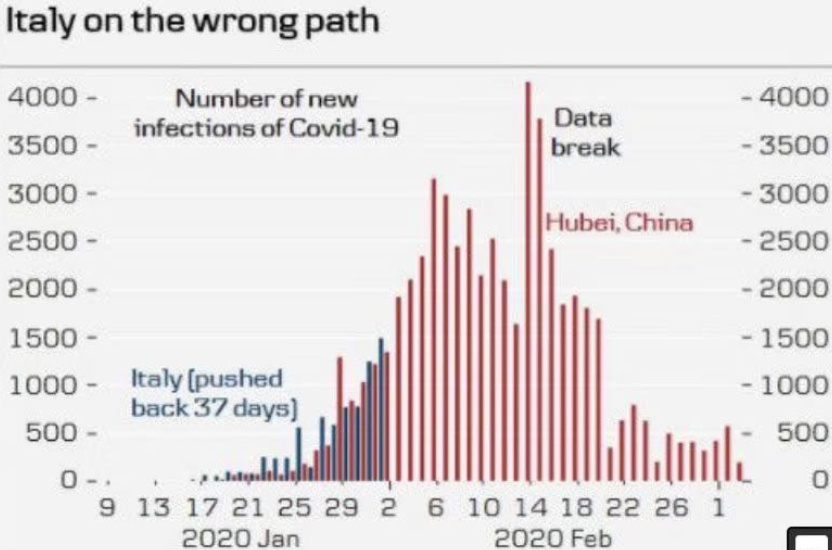
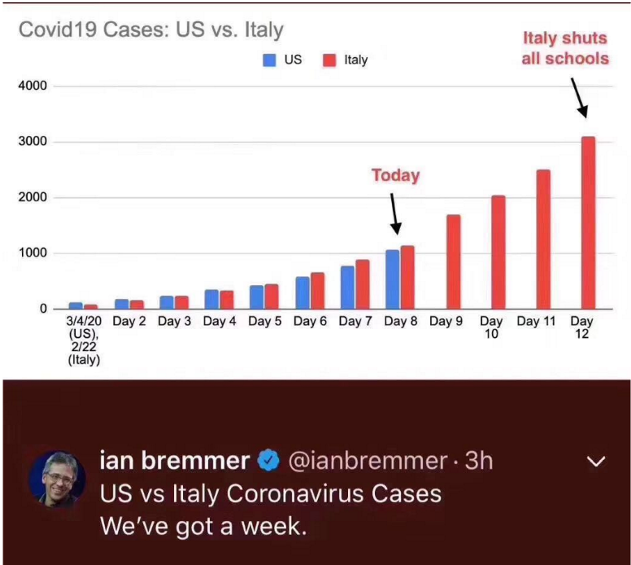
My first examples are the two column charts below, we can quickly get the idea that Italy is comparable to Hubei China and US is to Italy in daily number of new cases. Human eyes are very sensitive to the height of the columns so it is great to use column charts to make such comparisons. I like the first chart’s title more. It reveals the conclusion that you can draw from the chart.
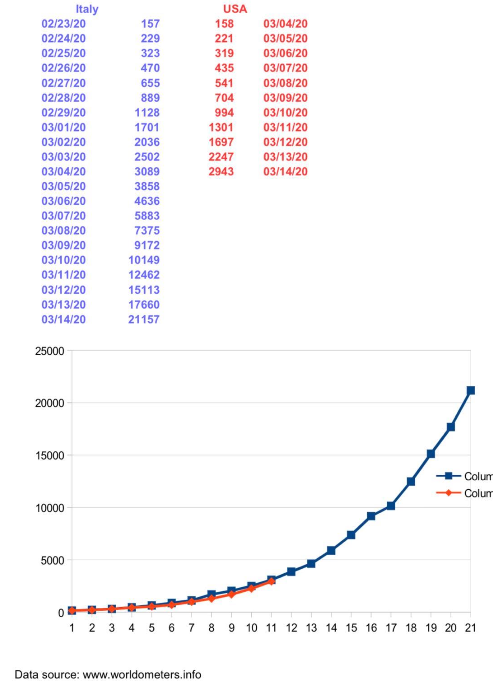
I have also seen some attempt to compare US and Italy with a data table and a line chart in number of total diagnosed cases like the one below. Tables are essentially the source for all the charts. We use tables when we need to compare or look up individual values or when we require precise values or the data has to communicate quantitative information, but not trends. However, the rate of the change is not easily grasped from a data table. We would be better off to use a chart because it conveys a message that is contained in the shape of the data. The line chart shows the trajectory change. Line charts are best suited for trend-based visualizations of data over a period of time, when the number of data points is very high (more than 20). With line charts, the emphasis is on the continuation or the flow of the values (a trend), but there is still some support for single value comparisons, using data markers (only with less than 20 data points.)
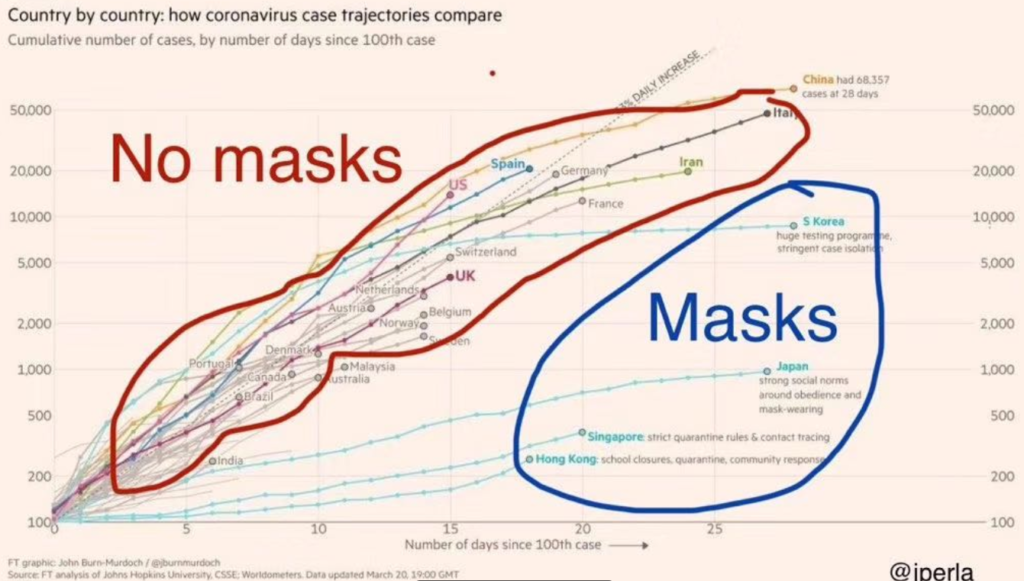
When we want to compare multiple countries, especially when number of countries exceed 4 or 5, we need to use line charts for comparisons. The chart below from John’s Hopkins university website compared 25 countries trajectory. It also calls out the countries using masks vs. those that don’t. Readers can tell the differences and get the idea that wearing masks seem to help slow down the spread immediately. A column chart will not work for such comparison.
I hope this post is helpful for analysts and data scientists to put more thoughts when creating a chart. A great chart needs some careful design and planning.