When we first look at some data, we will want to understand them. It’s an essential step before any type of modeling to explore the data and understand the data first. From exploratory data analysis, we can discover patterns. Patterns in the data provide clues about relationships. If a systematic relationship exists between two variables it will appear as a pattern in the data. Patterns provide one of the most useful tools for data scientists because they reveal covariation — correlation or causation. Models are a tool for extracting patterns out of data. This post is about how to do effective exploratory data analysis before modeling to make the modeling step much easier.
I will use a Telco Customer Churn data set to illustrate how to do effective exploratory data analysis.
There are two type of questions we want to ask as we are exploring the data.
- What kind of variations do my variables have?
- What kind of covariations do my variables have?
Variation describes the behaviors within a variable. Covariation depicts the relationship between two variables. There are two types of variables and the ways we examine the variation and covariation between them are different. The two types are categorical variables and continuous variables.
1. Variation
To check on the variation of categorical variables, we typically use bar plots. We always want to examine the target variable that we want to predict first. In this case, it is customer churn variable. We see from the bar plot that there are 5174 records that haven’t churned and 1869 churned records. There are no records with the target missing. About 27% of the data set are churn records. It’s imbalanced, but not bad. I will cover the imbalanced data issues and whether we want to do an adjustment in a future post.

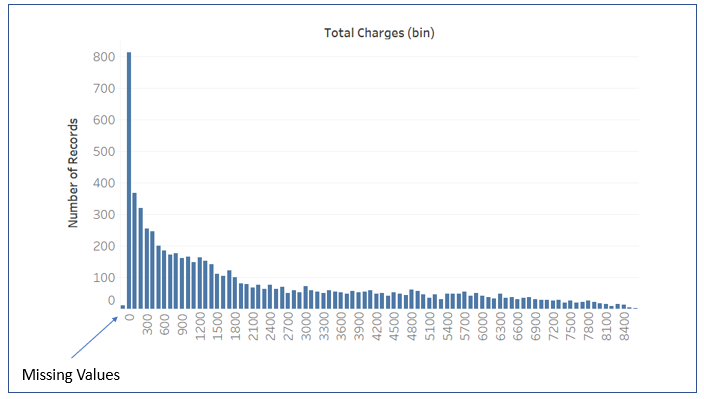
There are also some continuous variables in the data set, namely total charges, monthly charges and tenure. We use histograms to check on the variation or distribution of continuous variables. Total charges variable in this data set has some missing values and right skewed.

2. Covariation
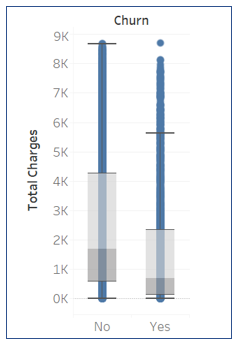
To discover relationship between a categorical and a continuous variable, we can use box plots. From the below plot, we see that the total changes are lower for those who churned and there are some outliers in the churned group.

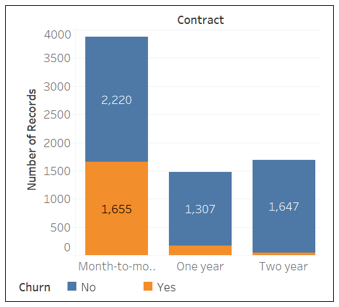
To find relationship between two categorical variables, we can use tile plot/heat map or a stacked bar plot. From the heat map below between internet service and contract, we can see that the churn rate doubled for customers who have the fiber optic internet service and under the month-to-month contract compare with the overall churn rate. The stacked bar plot between contract and Churn shows the month-to-month contract type has a much higher churn rate compare with the one year or two year contract.


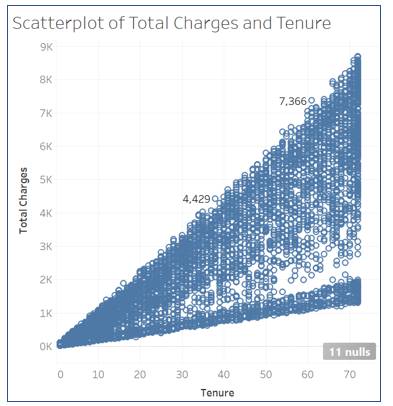
We use scatter plot to discover relationship between two continuous variables. The scatter plot between total charges and tenure variables show a positive correlation.

All patterns we discovered from exploratory data analysis helps us with the modeling process to predict the customer churn rate. From the above brief demonstrations. We have already found the follows:
- The churn variable is imbalanced. Churn records are 27% of the data.
- Total charges variable has missing values and we need to further explore and treat it before model construction.
- Total charges may be a significant variable to predict churn. It has significant differences between loyal and churn groups.
- contract type seems to be a significant variable to predict churn. Month-to-month contract has a much higher churn rate.
- contract type has interaction with the internet service variable.
This is not meant to be a complete data exploration of the customer churn data set, rather I hope this helps demonstrate methods we take to do effective data exploration in order to discover patterns and relationships to aid model building in the next step.
Pingback: Data Exploration with Some Great R Packages – Fantastic Stats
Pingback: Binning Continuous Variables the Right Way for Insight Discovery – Fantastic Stats