Maximizing the marketing campaign’s incremental impact is more important than ever during this challenging time. We want to get the maximum return out of the marketing dollars spent. Therefore, we need to target people who are ONLY likely to buy if they are included in a campaign. Targeting people who are going to buy anyways without the contact, or targeting people who are not going to buy no matter what we do is a waste of money and efforts. This post will showcase how uplift modeling allows us to drive greater incremental sales and significantly enhanced campaign effectiveness.
Uplift is also called true lift, incremental lift etc. It measures the incremental impact a campaign brings to a company. By incremental impact, we mean in a traditional A/B test setting, the difference between test group’s conversion or sales and control group’s conversion or sales. Traditional propensity modeling approach attempts to predict how likely people are going to buy or respond to a campaign. The problem with it is we often target people who are likely to buy by themselves without any need for targeting. Another approach is a step further than the traditional propensity modeling approach. It is called uplift modeling. It is used when we have a marketing campaign with a test and control group. There are two approaches for uplift modeling. 1) a two-model approach: one model built on the test campaign group predicts the probabilities of buying with targeting. The other model built on the control group predicts the probabilities of buying without targeting. We then calculate the difference between the two probabilities. This delta represents how likely one is going to buy ONLY if targeted. The problem with the two model uplift approach is that neither of the two models has the prediction of uplift as its goal. The two models are propensity models. While it is the case that if both models were perfect, their difference would perfectly model uplift, as the models depart from perfection we would expect that the errors in their prediction of uplift would increase significantly faster because errors add when models are subtracted. 2) One model approach. There are several ways we can model uplift directly. Jaskowski and Jaroszewicz (2012) has outlined a new approach that by transforming the target variable, we can use the traditional propensity model approach to create a uplift model. Now that we have the uplift as the modeling goal. The drawback with this approach is that with one model we assume that the same set of predictors can predict those who will buy on their own without targeting and those who won’t buy even if being targeted, which may not be the case. The two model approach can often work fairly well. In practice, I suggest trying out both approaches and select the one that performs better on the validation set.
In this post, I will compare the performance of the propensity modeling approach, the two-model uplift modeling approach and the J&J uplift modeling approach on a real world email marketing campaign data set.
Data Set Used
A very good available data set is the MineThatData E-mail Analyitics and Mining Challenge, 2008, usually referred to as the “Hillstom challenge”. It contains records of 64K customers who last purchased within 12 months, and were split randomly into 3 groups. About 1/3 of the customers were not targeted at all and is used as the control group. The other 2/3 were targeted by two different versions of e-mail campaigns — the men’s and the women’s version. We use the data on the men’s campaign and the control group data for this post. The men’s targeting group is referred to as the test group hereafter.
There are also three outcomes available, visit to the website, purchase or conversion and spend amount. For this post, we will use the purchase/conversion as the target.
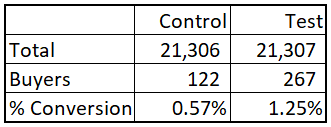
Here is the basic stats of the dataset. Control and test groups are roughly equal in size. The men’s campaign incremental conversion lift between test and control is 0.68% (=1.25%-0.57%).
Model Evaluation and Comparison
Methods of evaluating uplift models are based on an assumption that customer records which are similarly scored by a model behave similarly. In other words, we assume that the k percent of the treatment data set which the uplift model scored highest is comparable to the k percent of highest scoring cases in the control data set; gains on the top k percent of cases in both datasets can thus be subtracted from each other to obtain a meaningful uplift estimate. We rank order all customer records using the models, split them into 10 equal-sized groups called deciles with decile one being the highest scored ones. For uplift models, the higher scored ones means the customers are predicted to generate the highest incremental lift for the company. For purchase propensity models, customers with higher scores means they are more likely to make a purchase than those with lower scores.
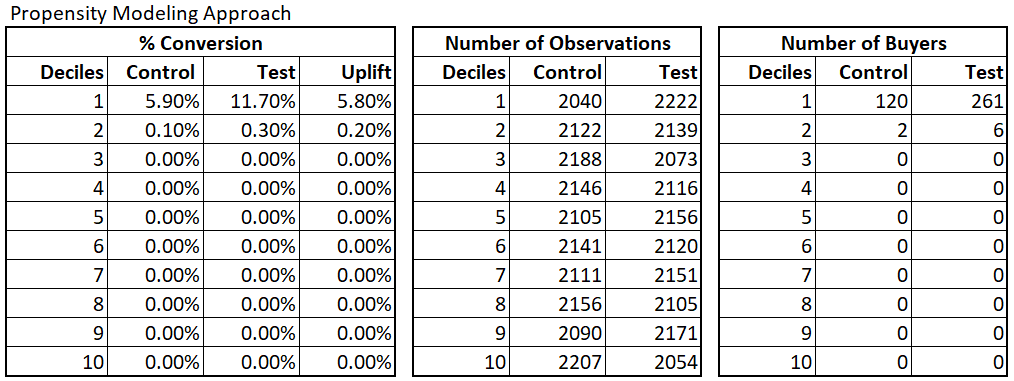
We ran random forests for all three approaches. All three model’s results are below. The propensity model was very good in capturing the customers’ purchase intention. The customers who ended up purchasing got higher propensity scores than those who did not. The incremental conversion % is 5.8% in the top decile.
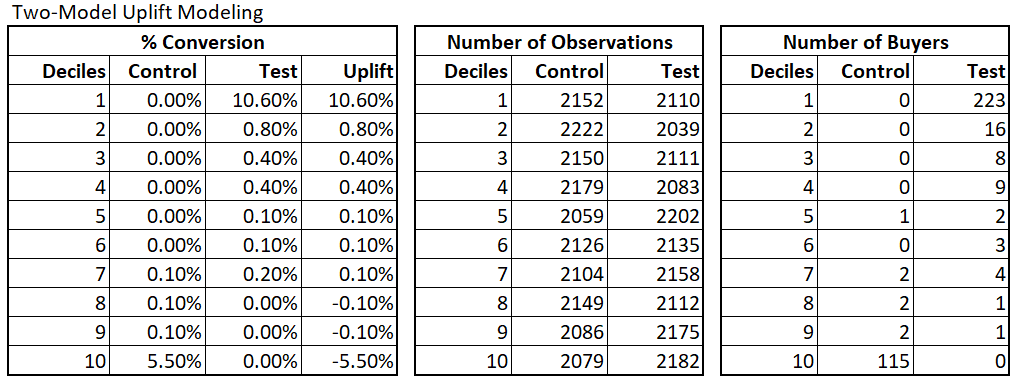
The two model uplift modeling approach is able to distinguish those who would have purchased on their own and those who are likely to purchase when targeted well. It nearly doubled the top decile’s incremental lift. Notice that the bottom three deciles have negative incremental lift. It means that targeting those three deciles do not yield any possible impact. Therefore, company should not target those in the bottom three deciles. That is the company will need to contact 14838 customers and achieve a 1.8% incremental lift overall.
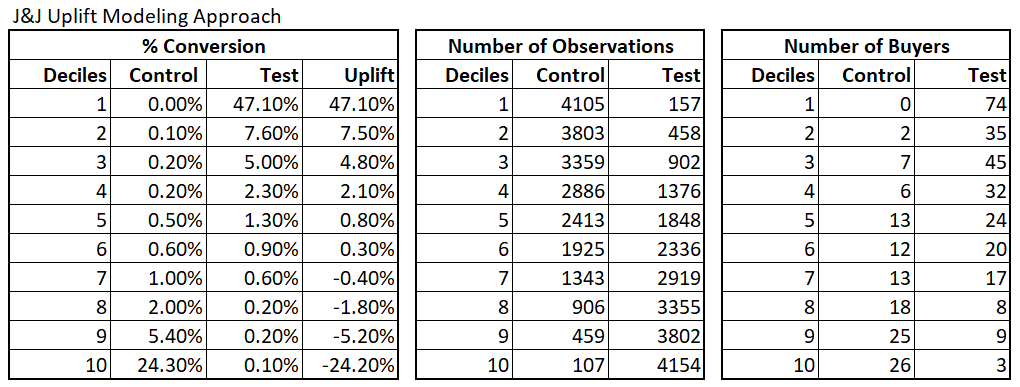
Finally, the one model uplift modeling was able to identify those who would only respond to very well. The top decile is an amazing 47.1% incremental lift. The company don’t need to contact the bottom 4 deciles that yield negative incremental lift. That is, the company only need to contact 7077 customers and obtain a 3% incremental lift.
End Notes
J&J one model uplift modeling approach performs the best for the chosen data set. It is recommended to try both two-model and one model approach for your marketing campaign to pick the better one.
I have frequently found that the last one or two deciles are negative on the data sets used to build models. Whenever the contact cost is non-negligible, campaigns tend to become unprofitable if we try to target everyone without any targeting modeling. Though uplift model works particularly well for the campaigns that often incur a cost. For email campaigns that have a minimal cost, reducing the number of contacts that a customer receives can often reduce the risks of unsubscription or churn. Being smart in who we target or contact can often reduce the negative effects that marketing contact can bring.