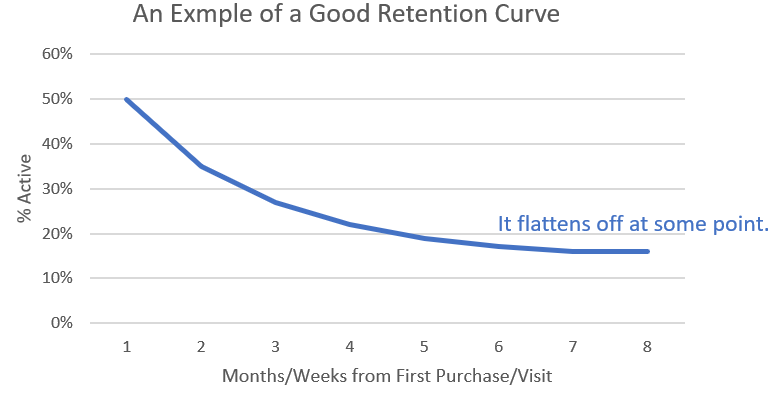
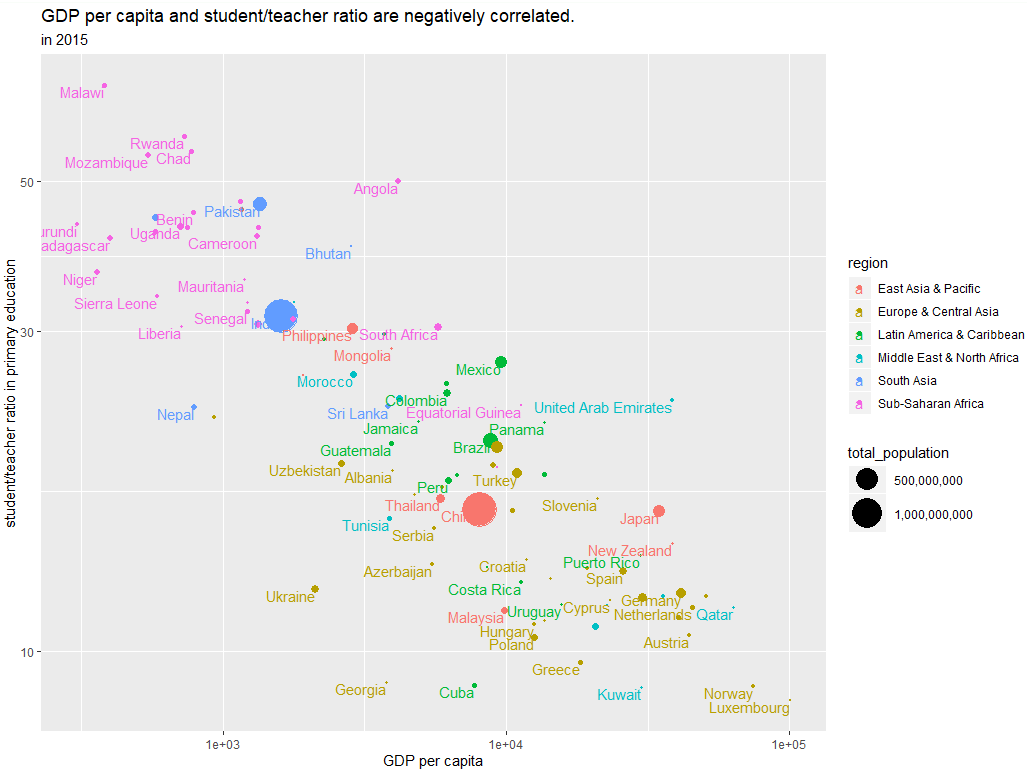
Effective Exploratory Data Analysis

When we first look at some data, we will want to understand them. It’s an essential step before any type of modeling to explore the data and understand the data first. From exploratory data analysis, we can discover patterns. Patterns in the data provide clues about relationships. If a systematic relationship exists between two variables… Read More »

Charts for COVID-19

I love charts. And I believe one of the criteria to separate a great analyst from a OK analyst, a great data scientist from a OK data scientist is whether the analyst or data scientist can convey the information in a chart that’s very intuitive and little brain power is needed for the audience to… Read More »

The Most Important Metric for Any Business

If I get to pick one metric or one graph to look at for any business, big or small, to determine if the business is in a good shape, I will look at the retention metric and the corresponding retention curves. Retention is the NUMBER ONE thing that every business should look at, any business… Read More »

Forecasting with Simple Moving Average

I have found many times throughout my career that simple methods can work extremely well and sufficient for business needs. They can be fast and effective than some sophisticated complex methods. One time I was approached to help forecast the daily number of signups who will convert so that business resources can be planned accordingly.… Read More »

Step by Step on Constructing a Great Graph

A graph is worth a thousand words, though not always. Not all graphs are created equal. I would say a great graph is worth a thousand words. What is a great graph? Let’s start from scratch to construct a great graph to show you how to get to one. The data I used is from… Read More »